Why lead is a problem
Lead is an element found in air, water, soil, and man-made products such as paint and plumbing pipes. In the past, lead was used as an additive in gasoline to improve car engines’ performance. We now know that lead exposure can lead to health effects for people. According to the U.S. EPA, lead has different effects in different populations.
Health Effects of Lead Exposure in Children
- Behavior and learning problems
- Lower IQ and Hyperactivity
- Slowed growth
- Hearing Problems
- Anemia
Health Effects of Lead Exposure in Pregnant Women
- Cause the baby to be born early or small
- Hurt the baby’s brain, kidneys, and nervous system
- Increase the likelihood of learning or behavioral problems
- Put the mother at risk for miscarriage.
Health Effects of Lead Exposure in Older Adults
- Cardiovascular effects, increased blood pressure, and incidence of hypertension
- Decreased kidney function
- Reproductive problems (in both men and women).
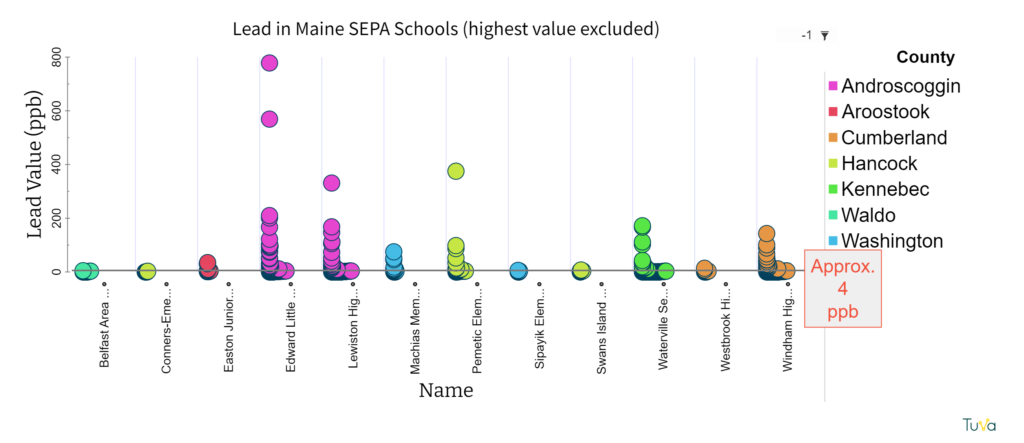
There has been a growing effort to reduce lead exposure. It is no longer added to paints and gasoline. Lead is regulated in public drinking water. The U.S. EPA standard for lead in drinking water is 15 ppb. In Maine schools, the standard has been lowered to 4 ppb.
Our “Communicating Data” SEPA has an added focus on lead. We have created resources to help teachers and students learn about lead and explore the issue, including a StoryMap and drinking water datasets to explore on our Tuva platform. If you are engaging your students in a study on lead, consider engaging them in the sequence of activities below:
1. EPA’s New Lead and Copper Rules
In October 2024, the EPA released the new Lead and Copper Rule Improvements (LCRI) regarding:
- requiring drinking water systems across the country to identify and replace lead pipes within years;
- requiring more rigorous testing of drinking water; and
- improving communication within communities
2. Lead in Taps
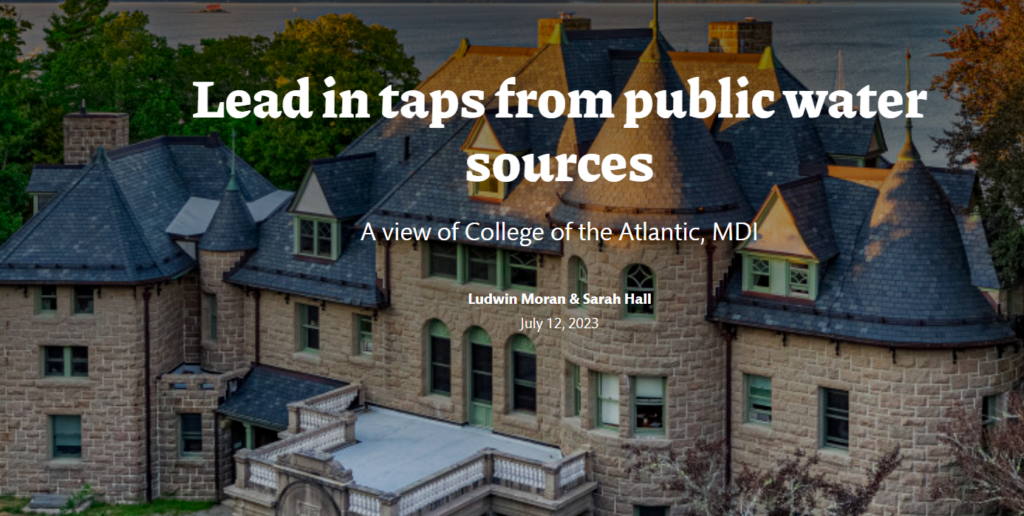
This is an ArcGIS StoryMap called Lead in Taps from Public Water Sources. It is one student’s exploration of tap water at the College of the Atlantic in Bar Harbor, ME. Students will see the progression of questions that this student explored and what they found out! This StoryMap is one of a collection of StoryMap resources on this website.
3. Explore the data behind the Lead in Taps StoryMap
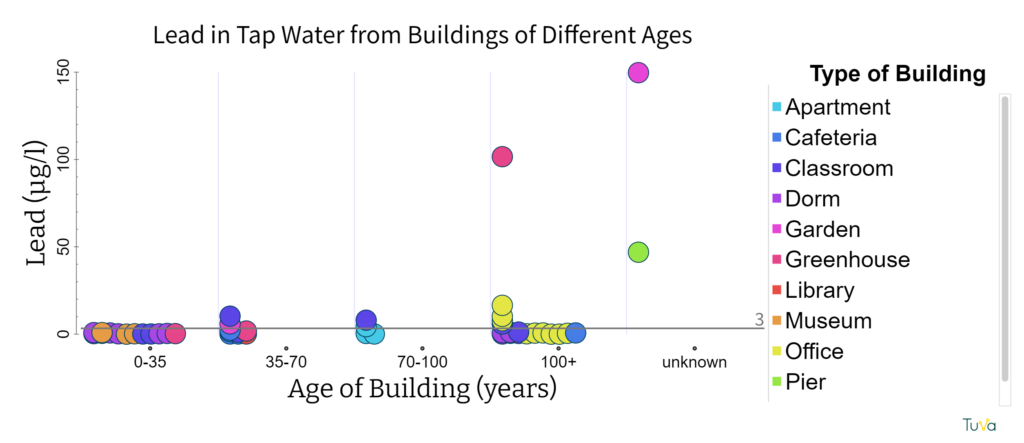
The data behind the StoryMap can be found on our Tuva platform. The first set of data is called “Public Water: College Campus Tap Variation.” Students can create graphs like the one below to understand the relationship between variables.
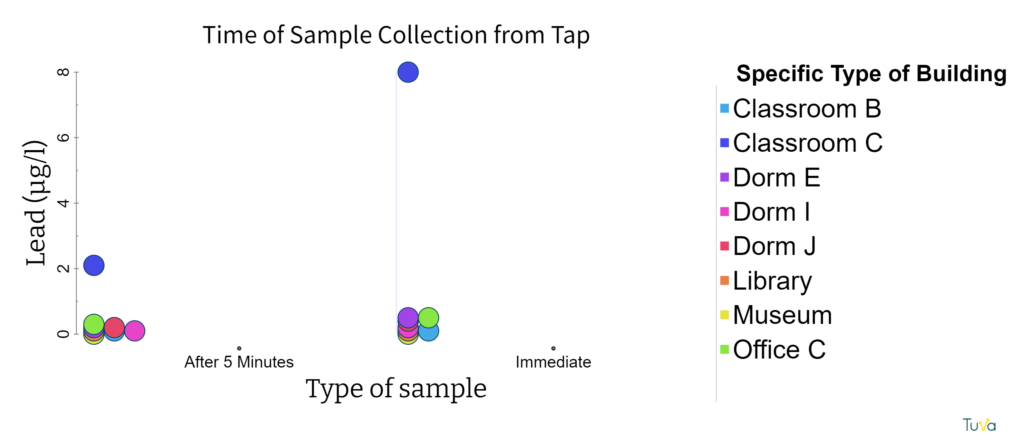
A second set of data is called “Public Water: Immediate vs 5-min Flush.” Students can see how the time of sampling affects the results of the drinking water analysis by making graphs like the one below.
4. Lead in Schools
In the 2021-2022 school year, all Maine schools were required to test all taps for lead. The results of the testing can be viewed in the map below. More details on the testing and results can be found on the Maine Department of Health and Human Services website.
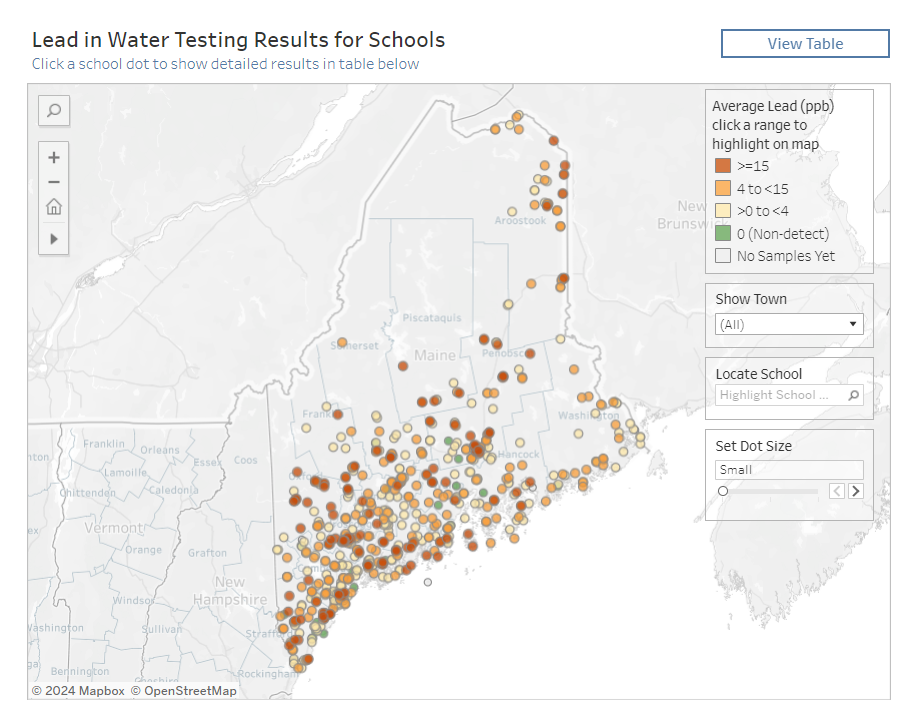
5. Explore the Maine School Data
Some of the data from the Maine Department of Health and Human Services website (depicted in the map above) is now available on our Tuva platform. Due to the size of the dataset, only information from our SEPA schools is included. This set of data is called “Lead Data from Maine SEPA Schools.” Students can make graphs like the one below to see how schools compare, which counties are most affected, and which taps in schools are most likely to be contaminated with lead. Just FYI, the highest lead levels are filtered out so you can see what is happening with the lower levels! You can always click on “Table View” at the bottom of the graph to see the actual lead values for faucets in your school.
6. Lead Levels in Children
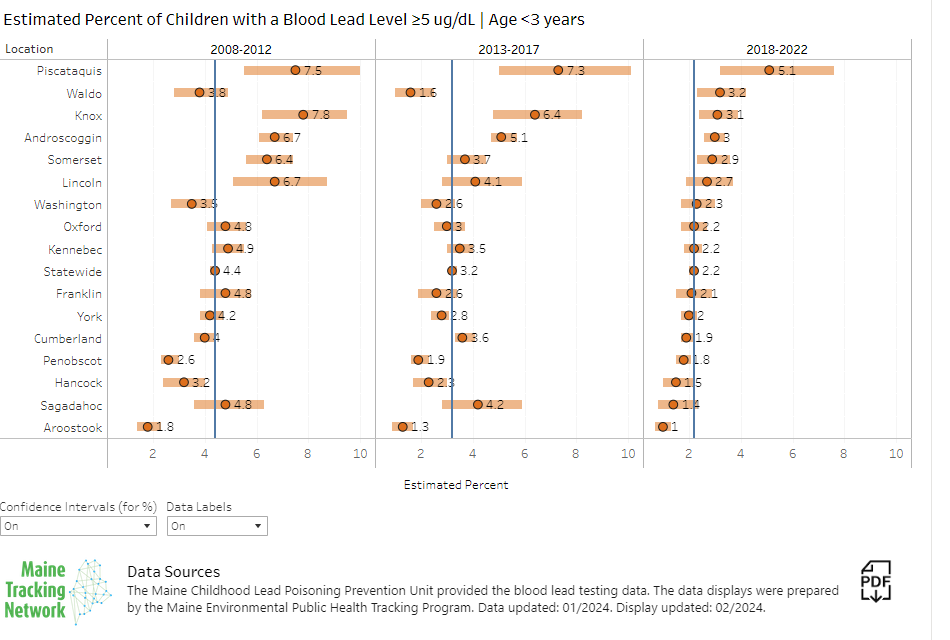
Have your students look at the Maine Tracking Network or the New Hampshire DHHS Data Portal to determine lead levels in children in their county. This could help them frame their message. How do we know lead is a problem in our community? Is it coming from drinking water or other sources like paint dust? Why is it important to test for lead in public buildings and private homes, even when they are on public water sources?
7. Public vs Private Water
Perhaps students are not aware of the difference between public and private water. There is a Digital Interactive Notebook in our SEPA collection designed to help students understand this difference. It is simply called “Public Drinking Water”. Lead shouldn’t be a problem in public water systems, as they are routinely checked for lead and other contaminants. However, lead can be found in old housing and school plumbing and can leach from old lead pipes or lead solder into drinking water. This is why the testing in schools was initiated and why it was important to check every tap in every school. Even if a school has a well, it is considered a public drinking water source if it serves more than 25 people.
